
TITAN - Trend-following research and simulation
I developed TITAN to test trend-following rules and monitor their simulated execution. The system calculates signals from market data, adjusts exposure and stores portfolio state.
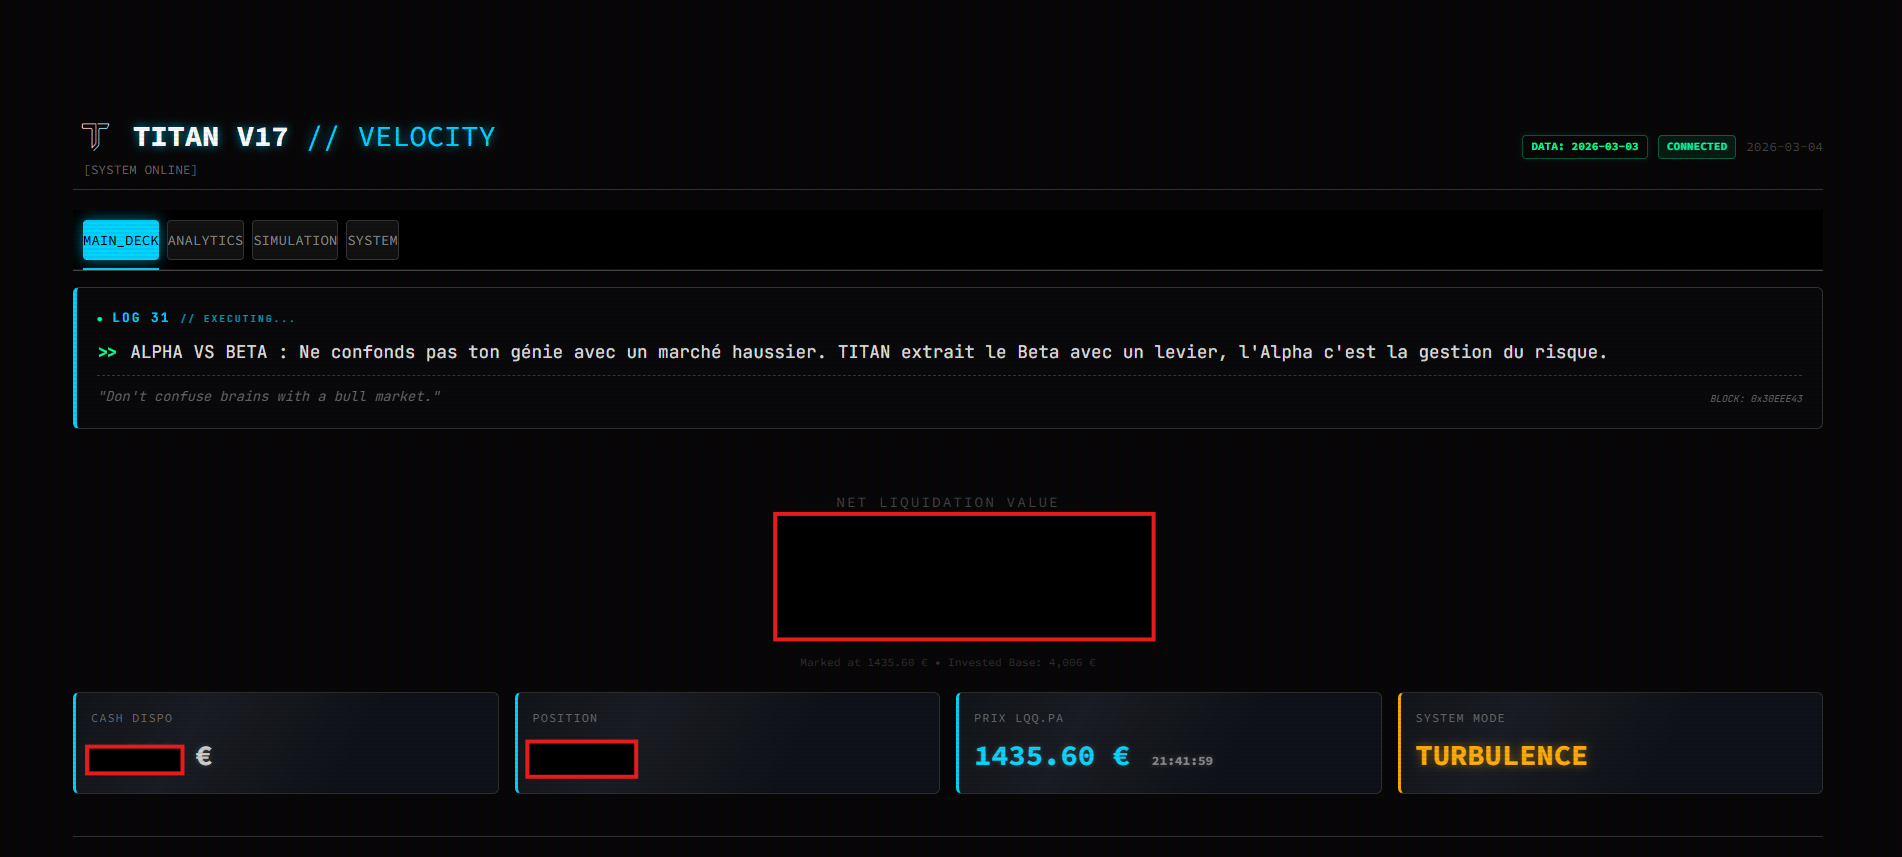 Portfolio and signal monitoring in Streamlit.
The Python engine uses Pandas and NumPy to simulate historical asset behavior. It reconstructs leveraged ETF series and includes cost assumptions, such as spreads and financing, to compare scenarios.
Simulated portfolio value and risk measures.
Telegram notifications deliver entry and exit signals, daily profit and loss, and estimated opening gaps. The dashboard provides access to calculations and historical records.
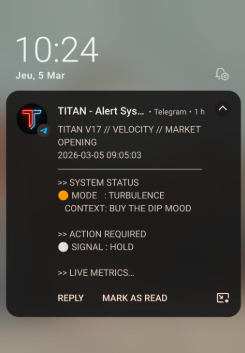 Reports sent by the system.
Rules and simulations
- Calculated trend signals using moving averages and volatility filters.
- Reconstructed leveraged ETF histories with assumptions for financing costs, spreads and compounding.
- Calculated time-weighted returns, CAGR, Sharpe and Sortino ratios, Ulcer Index and maximum drawdown.
Data and portfolio
- Fetched and consolidated daily and intraday prices with yfinance.
- Stored portfolio state and cash flows locally in JSON/CSV.
- Calculated realized profit and loss and holding periods using FIFO.
Dashboard
- Built a Streamlit interface with Plotly charts for portfolio value, returns and monthly results.
- Added access control and authentication for the interface.
Deployment and monitoring
- Packaged the application with Docker and Docker Compose for VPS hosting.
- Wrote scripts to compare simulated prices with market data.
- Integrated the Telegram API to deliver signals and performance reports.